Understand and quantify your major risks and know what you have to prove to get your product to market.
General approach
- Quantify the level of risk in a technology
- Ensure that all milestones are focused on reducing risk
- Identify milestones that are most important to reducing risk
- Communicate the reduction in risk relative to time and cost involved
Steps taken:
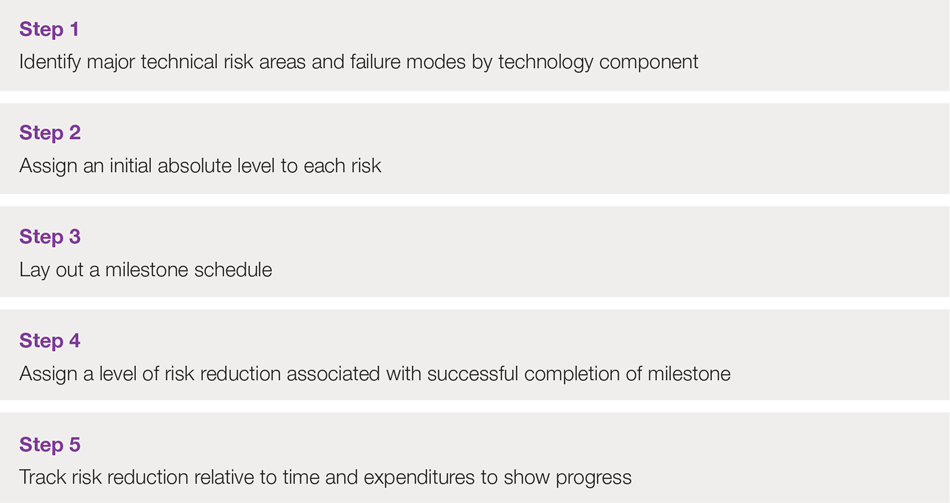
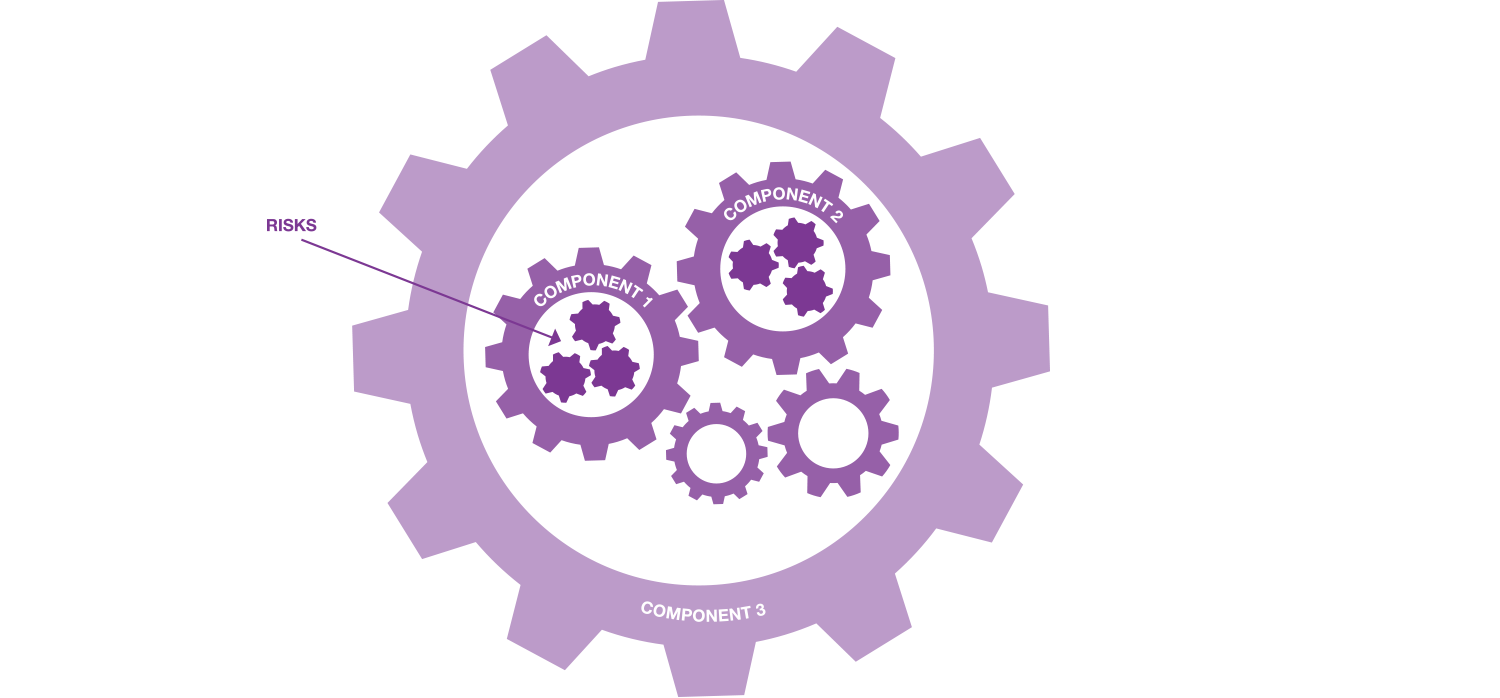
Step 1: Identify major technical risk areas
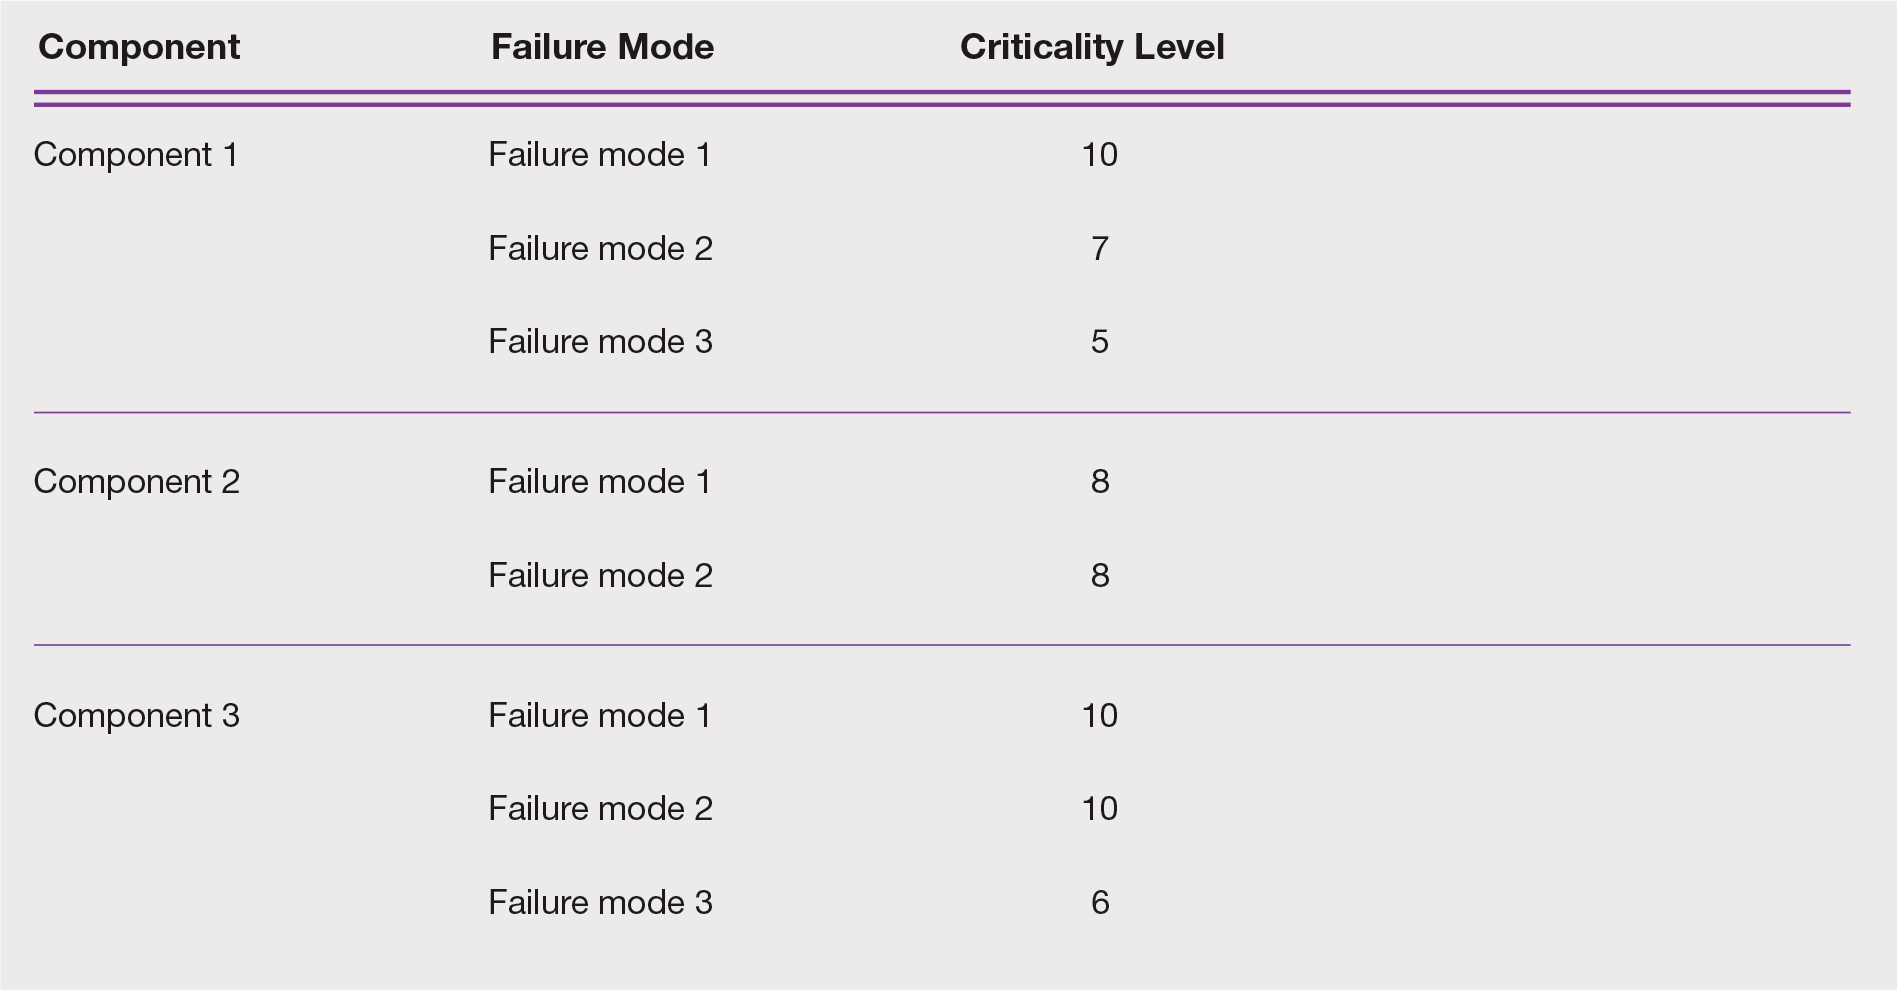
- Identify and group critical technical risks or failure modes by product component
- Groups of components also can have additional risks or failure modes
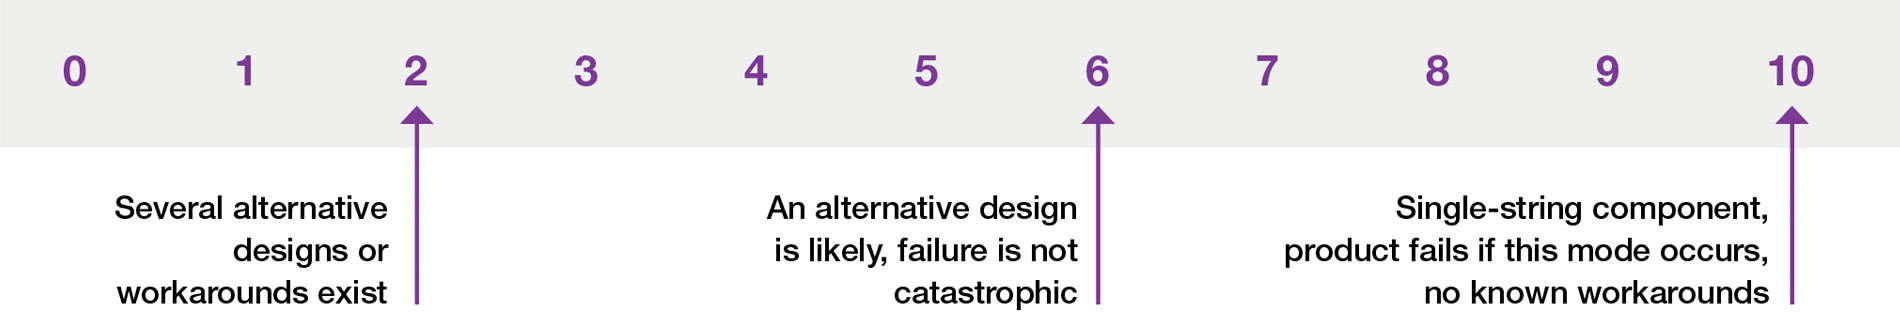
- Assign each risk a weighting factor on a scale of zero to 10, based on criticality and importance relative to component performance
- The weighting factors represent the importance of when something goes wrong
- Each component or component group also can be weighted relative to its importance to product success
- Each failure mode represents a different way that a component can fail
Step 2: Assign an initial absolute level to each risk
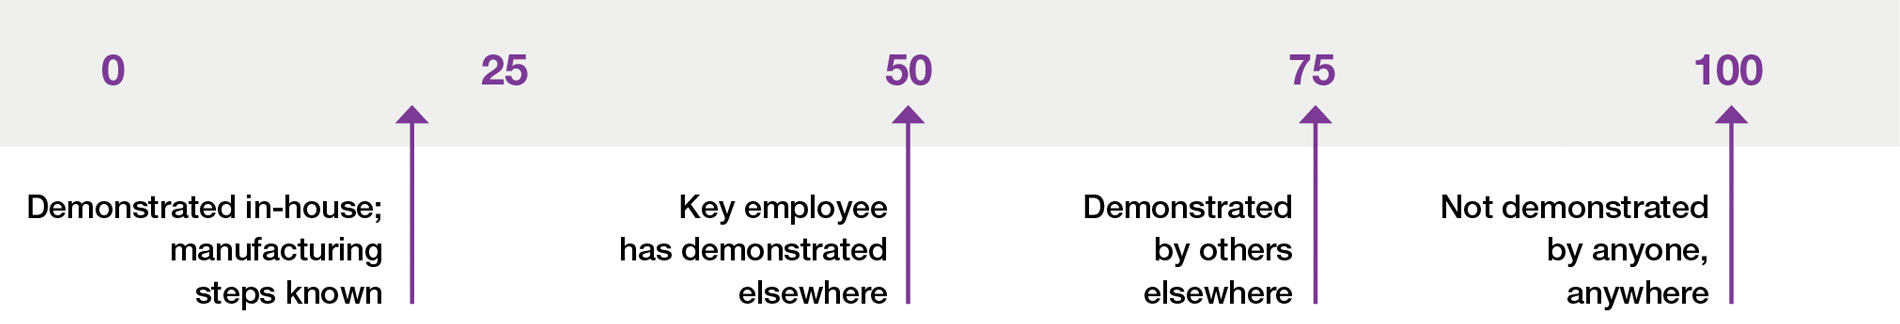
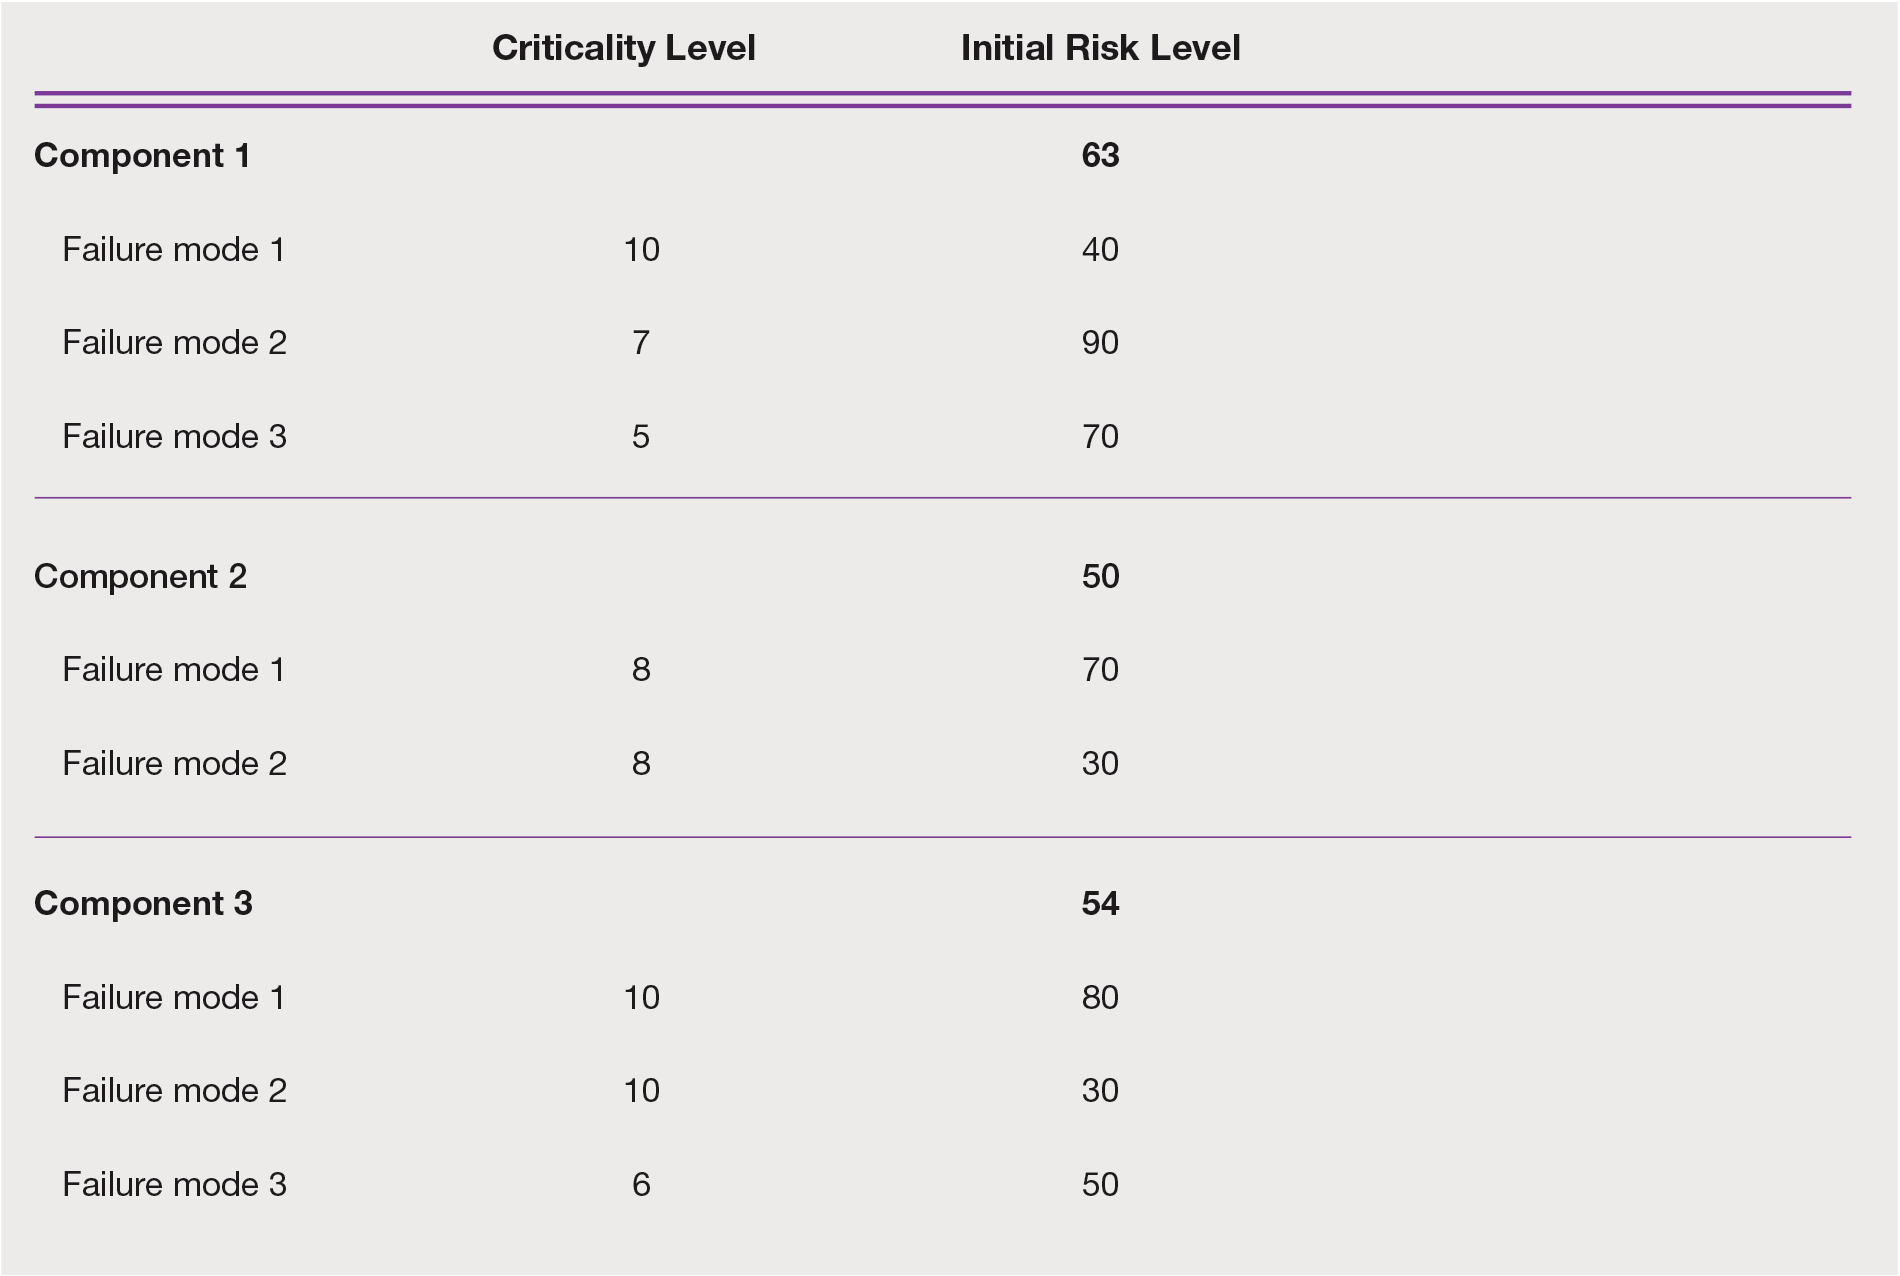
- Assign an initial and absolute risk level, on a scale from zero to 100, based on your level of confidence in preventing the failure mode at a manufacturing level
- The total initial level of risk of a component is the weighted average of the risk levels of the failure modes
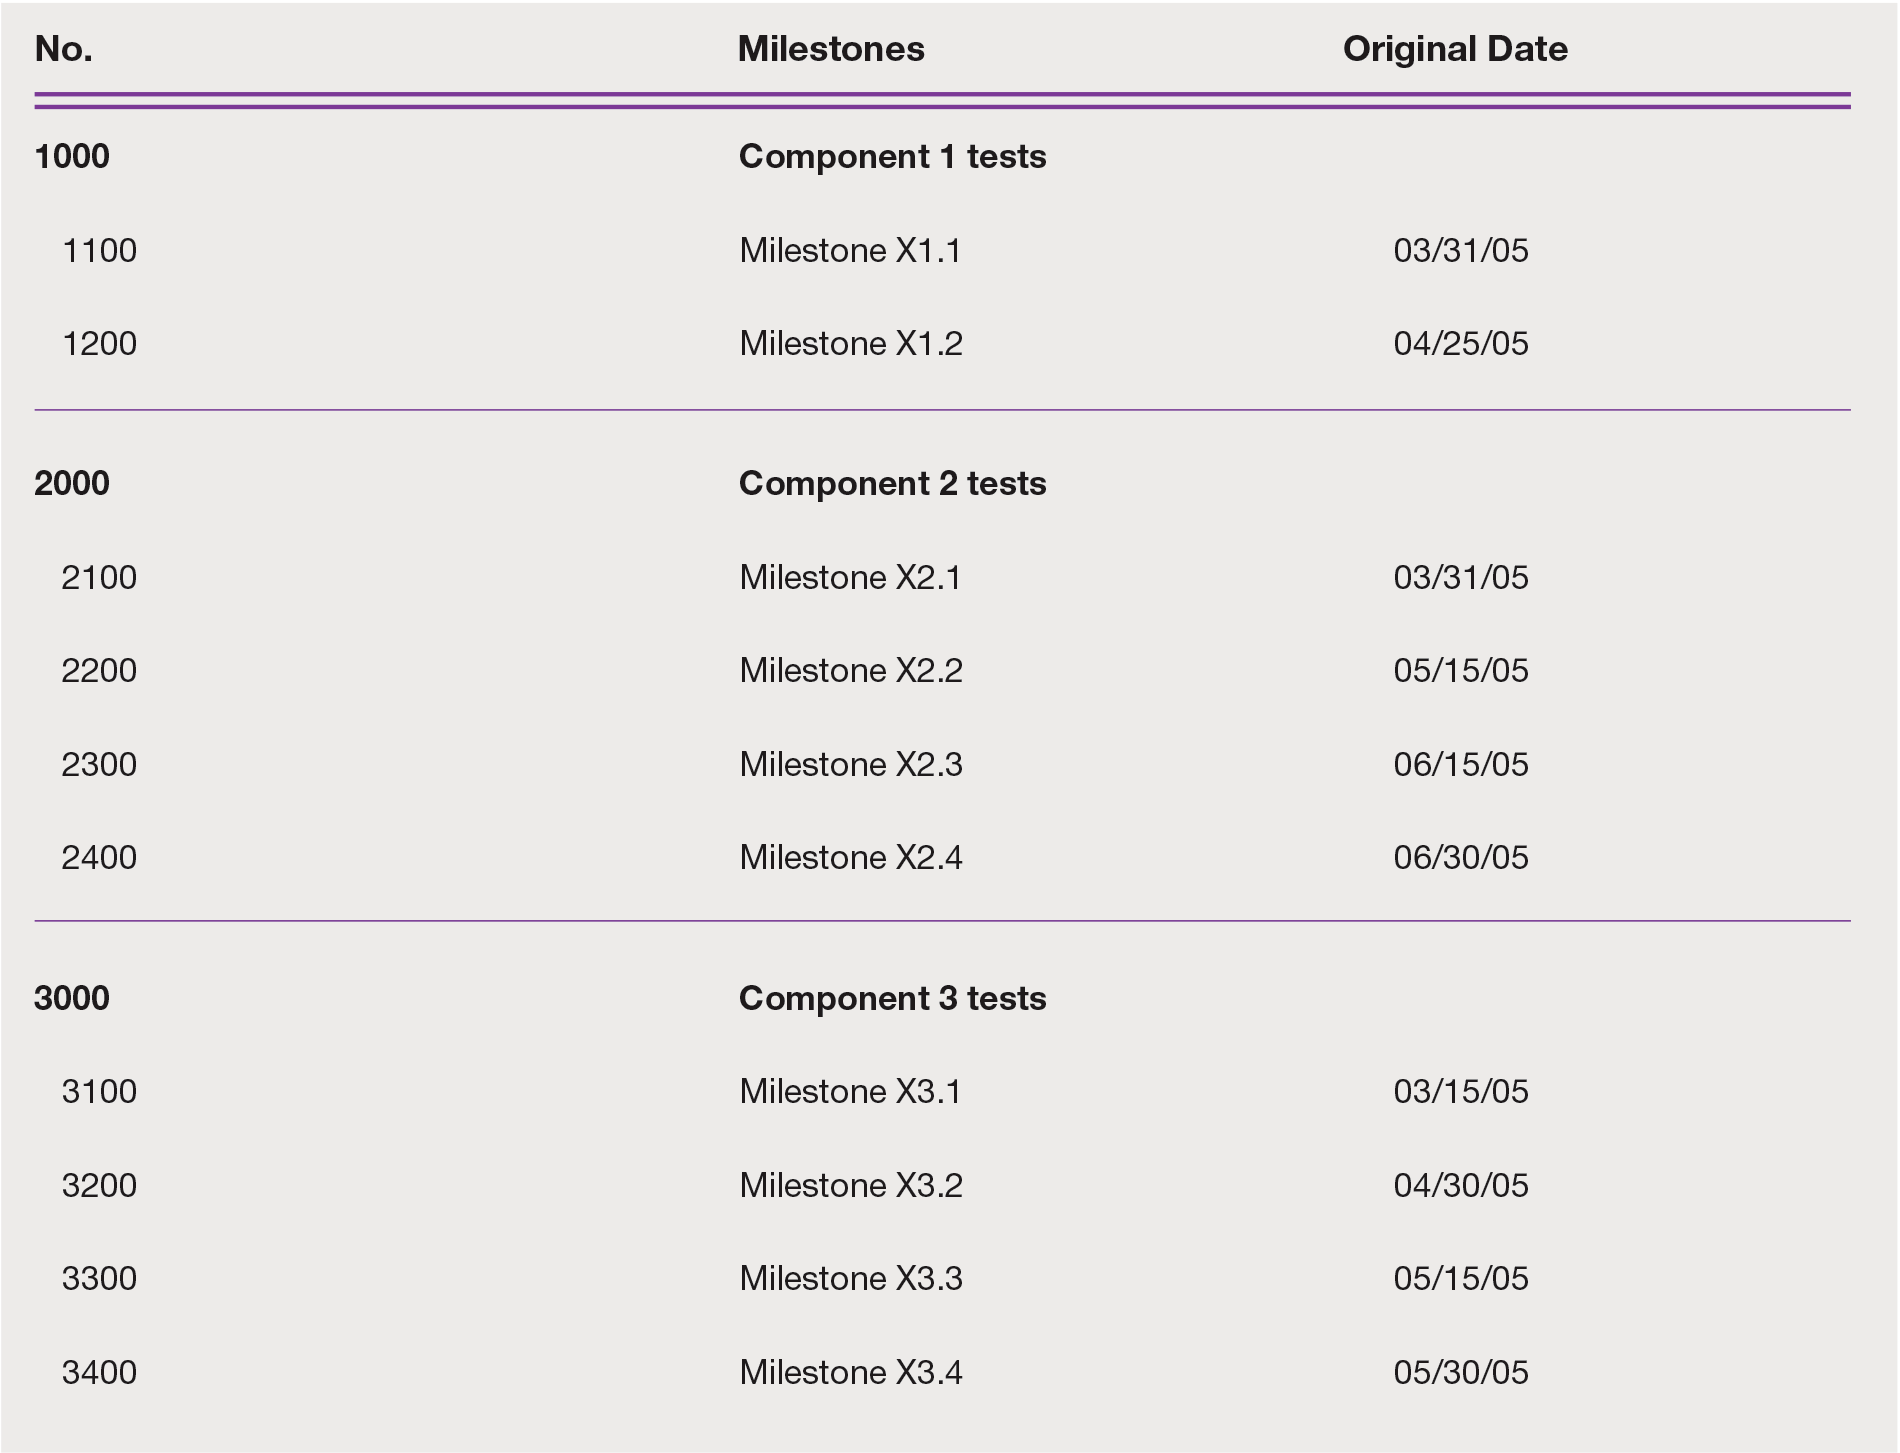
Step 3: Lay out a milestone schedule
- List major project milestones (from Gantt chart)
- Each milestone is expected to reduce risk in one or more categories
Step 4: Assign a level of risk reduction associated with successful completion of milestone
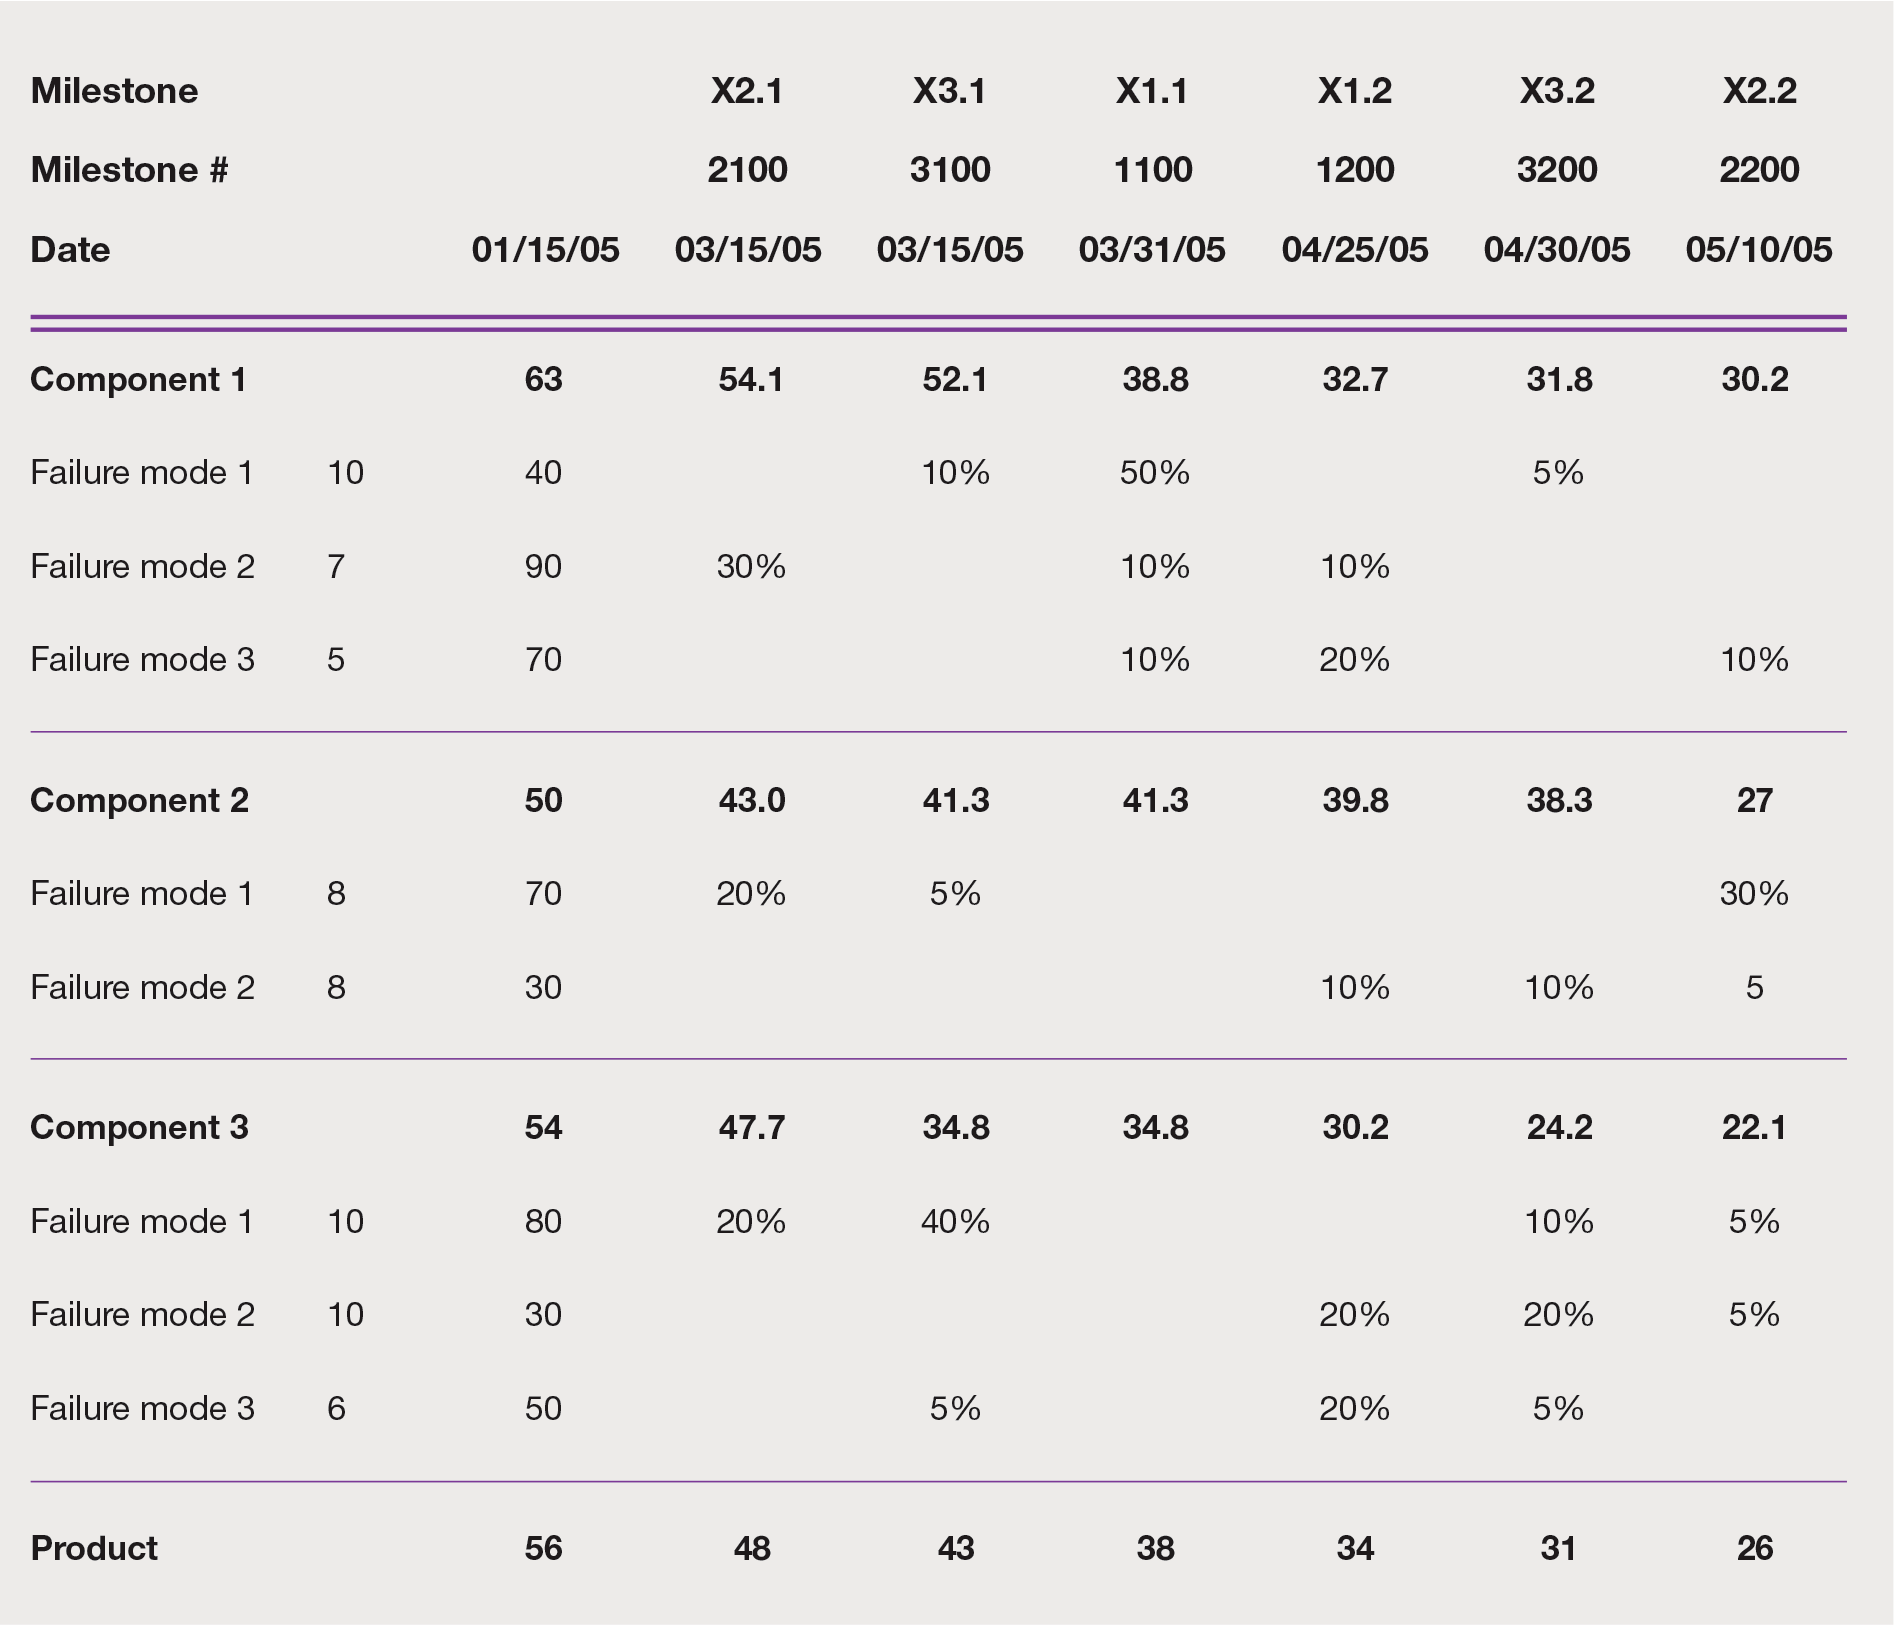
- Lay out risks and milestones in a matrix
- Each milestone reduces the risk of a particular failure mode by some percentage
- When a milestone is achieved, the absolute risk associated with a component falls resulting in a reduction in the overall product risk (the average of all component risks)
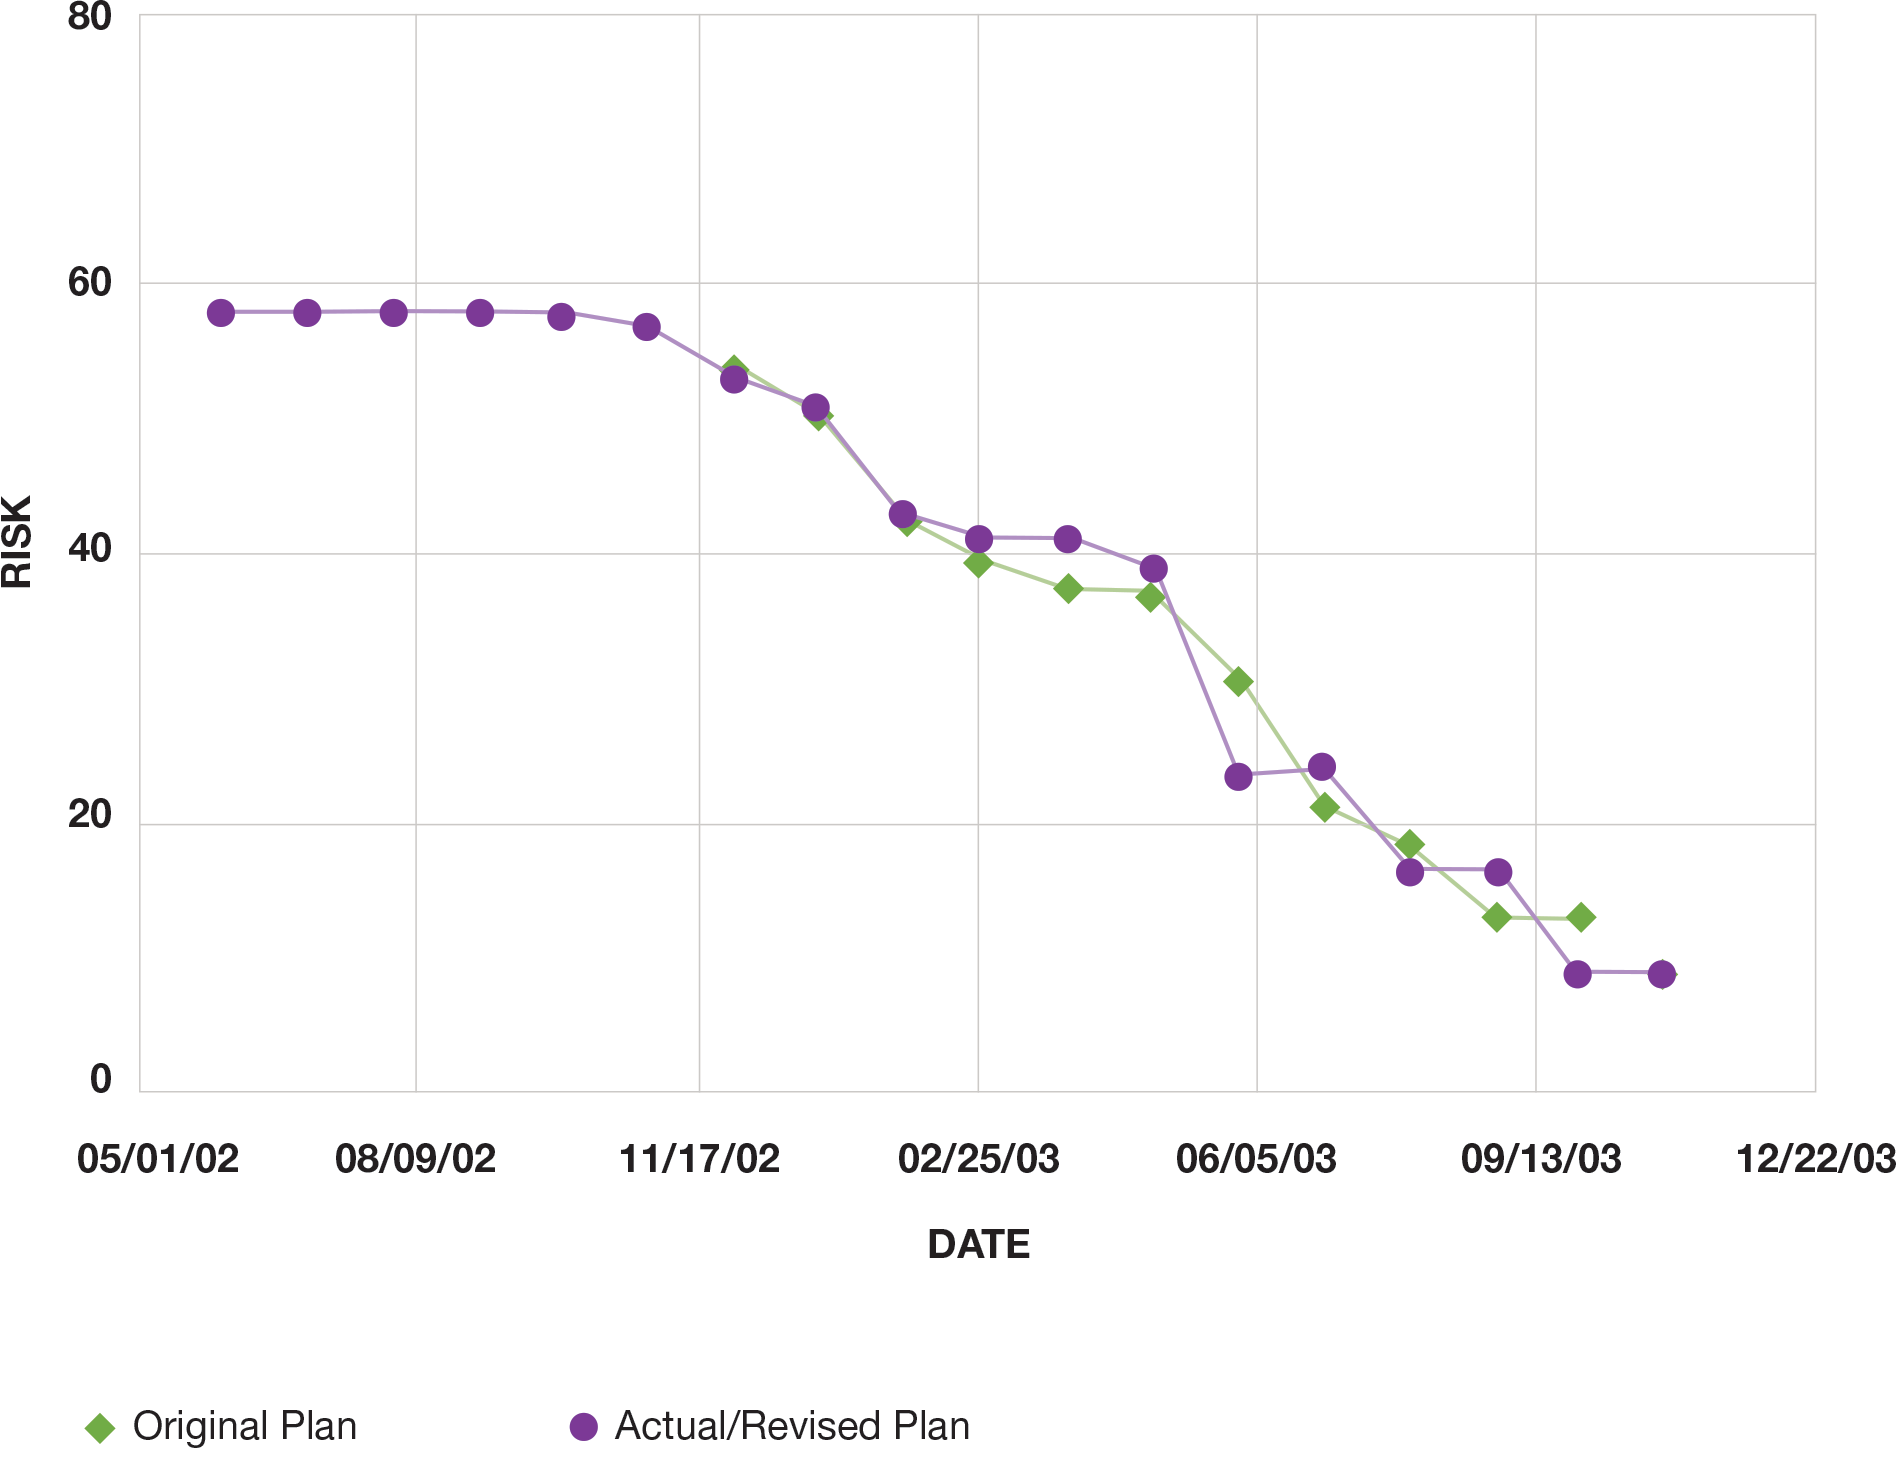
Step 5: Track risk reduction relative to time and expenditures to show progress
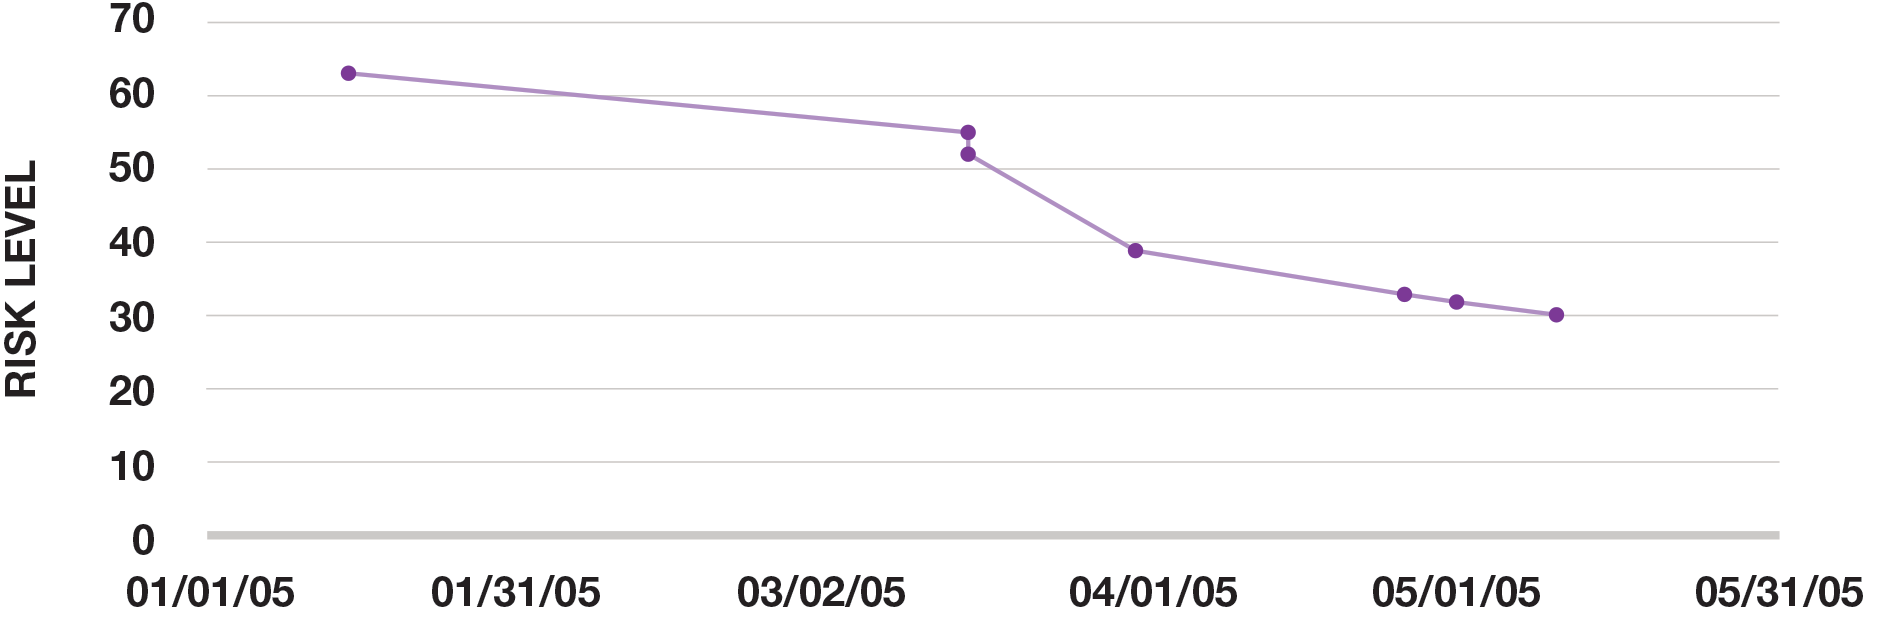
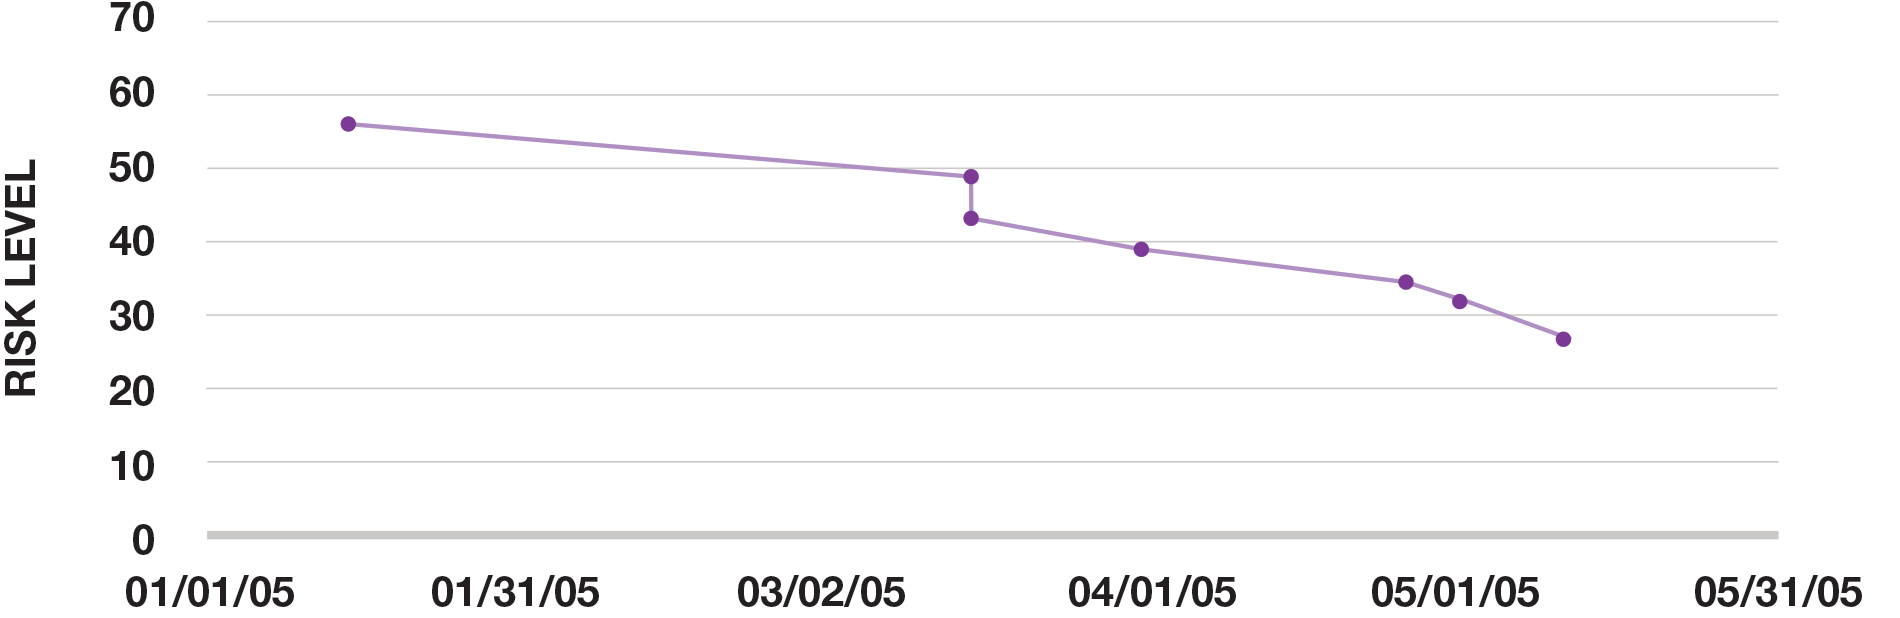
- For any component (and for product risk), risk reduction can be plotted relative to time and milestones
- Expenditures also may be plotted relative to time on the same charts
Single component risk reduction
Product risk reduction
Risk matrix example
Product risk reduction